
Cryptocurrency is a trending topic and the most valuable digital currency of the 21st century. Its potential and profit inspire many people to invest in these digital gold nuggets. Over time, different resources come into use in trading, and a candlestick cheat sheet is among them.
The stability of the crypto market in the past years is the main reason for the rise of cryptocurrency. Even though crypto is safe, easy to get, and profitable, it still doesn’t mean that anyone can do trading with their eyes shut.
First and foremost, no one can succeed in the cryptocurrency world if they don’t know about trading. Remember, the concept of trading is not rocket science. But still, it’s not as easy as pie because of the complicated charts and patterns and things like scalping.
It would be best if you learned the basics of candlestick charts to understand the market of crypto. That’s why I’ve come up with this article to provide you with a candlestick cheat sheet. So, you can easily understand some basic patterns of candlestick charts and start trading.
What is a Candlestick Pattern?
Candlestick pattern is a necessary term used for financial analysis. This concept originated in Japan in the 18th century to track the price of rice in the market.
In cryptocurrency, candlestick patterns show the information and data about the open, closed, low, and high cryptocurrency market prices. That helps the investor to make better decisions.
Candlestick Cheat Sheet Key-Points
As I mentioned before, that candlestick pattern sheet shows the price of an asset, but how can you understand these prices?
The Candlestick pattern cheat sheet is not overwhelming as it seems. You need to learn some key points called OHLC (Open, High, Low, and Closed) to get a handle on it.
Reading Guide for Candlestick cheat Sheet
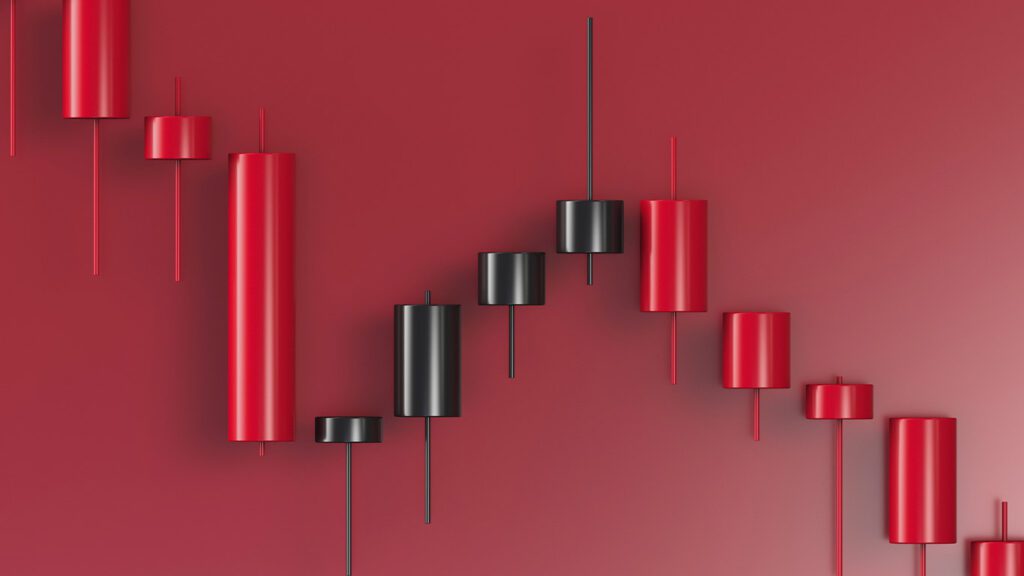
Before starting the Candlestick Patterns cheat sheet breakdown, you need to know about the candlestick’s shape consisting of two main parts. Read the colors guide after going through these parts.
Body
It is a vertical rectangle part of a candlestick. This part manifests the open and closed price of crypto.
O – Open Price
It shows the first trade of a specific time, whether it is the day, week, or month. For example, you set a week in the candlestick chart. Then the open trade would be the first trade on the first day of the week.
C – Closed Price
It is the last trade of a particular period. Assume that you set 15 minutes in the candlestick chart. Then the last trade of 15 minutes would be the closed price.
Shadow or Wicks
It is also called tails. This section indicates the lowest and highest price of crypto.
L – Low Price
L is the bottom side of the wick or shadow defining the lowest trading price during a specific time.
H – High Price
It is the top of the wick or shadow specifying the highest trading price during a particular time.
Colors Guide for Pattern
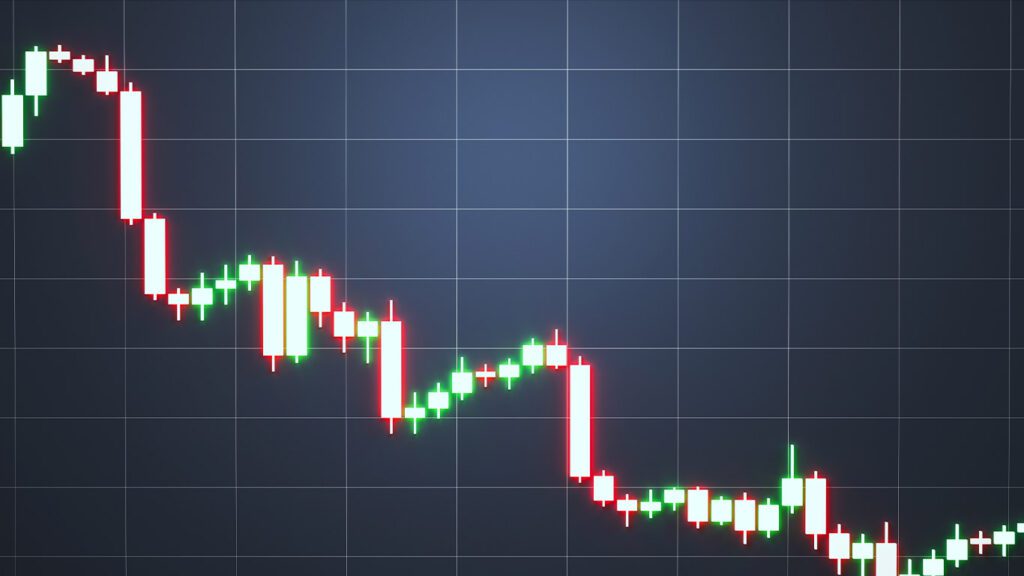
Other than the body and wick, one thing that also shows the data is the color of a candlestick. The red candlestick indicates that the trade price is lowering, and the green color indicates that the trade price is rising.
Candlesticks pattern has two types, Bullish and Bearish, which consist of 42 candlestick patterns. I know that it’s an overwhelming task for a novice to learn all about all patterns, but trust me, it’s worth all your effort.
Candlestick Cheat Sheet Patterns
All candlesticks stipulate something, whether it is a market opportunity or continuation of patterns etc. For that reason, it’s essential to learn or at least acquaint yourself with the basics fundamentals of candlesticks patterns.
Below I’ll give you a brief introduction to some effective and well-known candlestick patterns.
Bullish Candlestick Cheat Sheet Pattern
Bullish Candlesticks Appear after the downwards of the market. It stipulates that the market will again reverse to an uptrend.
Hammer Candlestick Pattern
Do you see a candlestick pattern with a petite body but with a long shadow or wick on the lower side? This pattern is called Hammer Candlestick.
It specifies that in the start market price was dropped because of sellers. Then it’ll revert to upwards because of buyers’ interference.
Engulfing Candlestick Pattern
Engulfing Candlestick pattern appears in green color usually after the downwards of the market. It covers the previous red candlestick completely.
This pattern indicates that the market has been down for a long time. Then due to buyers’ infiltration, the price goes up again.
The Morning Star Candlestick Pattern
The morning star is a sign of an uptrend. It shows in the shape of three candlestick patterns after the downward trend of the market price.
Bearish Candlestick Cheat Sheet Pattern
A bearish candlestick pattern is the complete opposite of a bullish candlestick pattern. These patterns are a sign that market prices will go down.
Hanging Man Candlestick Pattern
The hanging man candlestick comes up after the uptrend of price in the market. It has a small body, longer lower wick, and no upper wick. It specifies that the price will go down soon in the future.
Bearish Harami Candlestick Pattern
Bearish harami comes out after the bullish candlestick. The body of a bearish harami (in this case) is small compared to a bullish candle.
The biggest hint to identify bearish harami is that the entire body can be confined in a bullish candlestick. It denotes the fall of price in the market.
Shooting Star Candlestick Pattern
The shooting star appears after a high trend. This candlestick has a small body, longer top shadow or wick, and small or no lower wick. It also counts in reversal candlestick patterns, which we will discuss next.
It indicates that the buyer’s intervention market goes up. It goes down, and sellers will dominate the market.
Reversal Candlestick Cheat Sheet Pattern
Reversal candlestick patterns envision the upcoming downfall of price in the market.
Shooting Star Candlestick Pattern
In technical analysis, the shooting star pattern comes in the category of reversal patterns. It has a small body shape and a long top shadow or wick. It usually pops up between trends and helps traders to make many decisions in trading.
Bullish Harami Candlestick Pattern
The bullish harami candlestick comes after the bearish candle. The identifying feature of this candlestick pattern is that it can be confined in the body of the prior candlestick. With the help of this candlestick pattern, you can quickly identify the downtrend.
Continuation Candlestick Cheat Sheet Pattern
As the name said, the Continuation candlestick pattern denotes that the continuation of the price goes upward in the future. One thing to keep in mind is that this pattern does not confirm that the market will go up again.
Three White Soldiers Candlestick Pattern
Three white soldiers come in bullish candlesticks patterns; this candlestick emerges on the chart after a downtrend. This pattern anticipates that the market price will rise.
The biggest hint for three white soldiers is you can see bullish candles three times on the chart. All candlesticks’ opening and closing rates should be the highest to the previous one with small or no wicks.
The last thing you’ve to remember is that the second and third candlestick bodies must be equal and bigger than the first one.
Rising Three Methods Candlestick Pattern
The rising three methods are the pullback candlestick patterns. In this, the market goes down but again rises and stays strong like before.
It must have five candles. The first one should be bullish; the next three should be bearish. The last closing rate of the candle would be the highest of all, and it should be a bullish candle.
Frequently Asked Questions (FAQs)
How do you remember candlestick patterns?
To remember candlestick patterns is not as arduous task as it seems. Keep one thing in your mind every candlestick consists of two parts: body and wicks. Both details change their shapes and provide us with OHLC data.
You have to understand the concept of OHLC. Then there’s no doubt that you can identify the candlestick pattern like an expert.
What is the most powerful candlestick pattern?
You can value a candlestick pattern based on its reliability. Not every candlestick pattern is reliable for all traders. There are different patterns that we have discussed above. However, one cannot pick a winner as each has its role and depends on the trader’s preferences.
The most powerful one is that which works best for you and fulfills your requirements. You can use them on different occasions during your trading.
How do you master candlestick patterns?
Whoever wants to master the candlestick pattern needs to learn the basics. It includes fundamental concepts, such as candlestick parts, color, OHLC, and buyers and seller relations. After that, concentrate on patterns. Know how sellers and buyers think? And how do markets work?
How do you read candlestick volumes?
The volume shows you the correct quantity of trading during a specific time. You can easily see the volume result at the bottom of the OHLC result.
Conclusion
Candlestick patterns are necessary to learn for all traders. Bear in mind that no one can understand all candlesticks in a few days.
You need practice, and experience, and it comes with experiments. But before you do any experimentation, focus on the market, and learn how it works?
I hope that after reading this candlestick cheat sheet, your mind may be clear now. Enjoy your trading journey!