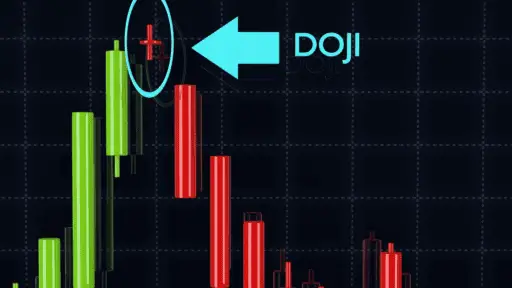
If you are new in the Crypto Industry & want to get the maximum benefit from your investment, you need to learn everything from scratch. There are hundreds of terminologies like the 50 Day Moving Average, SMA, EMA, and other graph values that are very vital.
Without knowing the basics, if you are going to enter the trading market, you are doing it wrong. Following your idols in the crypto industry can make or break you within seconds. Yes, it is a risky game. Therefore, learn the basics by investing your time and then enter the market.
This content will cover the topic of moving averages and why they are vital in the crypto industry. We will also discuss using the 50-day moving average chart to get maximum profit from your investment.
So, if you are a beginner and want to put your investment in the right crypto, then this article is worth gold. You will learn many essential points. So, without wasting more time, let’s move straight to our main topic.
50 Day Moving Average: Overview
If you are an investor, the term 50 Days Moving Average won’t be new to you. It is one of the essential technical indicators for stock breakouts and growth. Yes, you heard that right. Without understanding this terminology, you can’t say that you are an expert in trading.
50 Day MA gives valuable suggestions about the stocks by looking at their past 50 days’ stocking period. With this, you can understand whether the stock price will touch the upper or lower limits. So, in trading, it is like oxygen for the investors.
What Is A 50-Day Moving Average?
In stock trading, the 50-days MA is an SMA indicator that holds significant importance. You can say that it is one of the main building blocks in the trading industry. Without learning it, if you invest according to your mind, you will probably lose.
With the 50 Day MA graph, the trade signal line becomes pretty reliable & easy to understand. For the line creation, the average of the last 50 trading sessions’ closing price is noted & presented on a line graph that easily compares the current stock price.
So, it won’t be wrong to say that the 50 days MA is one of the first things you need to look at while analyzing the stock chart. If that specific stock is trading above the line, then you can consider it as strong. If its price is below, then it is getting weaker day by day.
Why Use A Moving Average?
Moving averages hold an essential place in cryptocurrencies. They are the trading tools or indicators used for smoothening the price data on the chart. If you think that they are the direct price indicators, then you are wrong.
Moreover, MAs only define the current direction based on the previous prices. They filter the noise present in the action plan and make it smooth. Also, they are the foundations of other indicators like MACD, McClellan Oscillator, and Bollinger Bands.
The two most common and popular moving averages are Exponential Moving Average (EMA) and Simple Moving Average (SMA). These indicators are vital to check the trend directions, resistance levels, and potential support.
50-Day Average Downsides
As the 50 Day – Moving Average uses historical data to present the upcoming trends; therefore, it is one of its drawbacks. Many times, the market upside and downside will become dependent on resistance levels and MA support.
On the other hand, the market doesn’t tend to become independent of the indicators mentioned above. So, it is also a risky game. We can also say that a 50-day MA will be better for the strong market conditions.
If you are going to invest in a choppy or unpredictable market, you can even lose your investment due to the historical data behavior of 50 Days MA. Therefore, invest at your own risk and never play blind.
50-Day Moving Average Vs. 200-Day Moving Average
If you have understood the fundamental behavior of 50 Days MA, then there is no rocket science in understanding the 200-Day MA. Whether you are planning to use 50 Days, 100 Days, or 200 Days MA, the calculation method of each moving average is somehow the same.
A MA in trading is nothing, just an arithmetic mean of some data point numbers. There is only one difference in the MAs mentioned above: their number of periods. For example, if you want to calculate the 50 Day MA, you need to take 50 data points.
Take 50 data points and divide the total number by 50 to get the 50 Days MA value. Yes, it is that simple. For calculating the 200 Day MA, take the last 200 Day data points; after summing up, divide them by 200.
Tips for How to Use the 50-Day Moving Average
If you are an expert, you might be familiar with how to use the 50 Days MA. However, if you are a beginner and want to invest your money in the right place without thinking about a huge loss, you need to go through some tips.
As discussed earlier, we will present six essential tips on how to use 50-day moving average charts. As a beginner, these six tips will help you in your trading in different cryptocurrencies. So, let’s start.
Understand Bullish and Bearish
If the stock price is above the 50-Day MA, it will be bullish. However, if the stock price is below the 50-Day MA, then it will be bearish.
Consider When to Think Long
If the stock price is the same as the 50 Day Single Moving Average as support and bounces upwards, it is time to play long. Prepare yourself for a big game.
Know When to Think Short
If the stock price is the same as the 50 Day Single Moving Average as resistance and bounces downwards, try to quit. Don’t invest at this moment.
Switch to Bearish At the Right Time
If the stock price breaks the 50 Day Simple Moving Average and goes downwards, you need to change your mind towards bearish.
Switch to Bullish When Needed
If the stock price breaks the 50 Day Simple Moving Average and goes upwards, it is time to switch towards the bullish.
So, if you are going to invest your money in the bitcoin cryptocurrency, then first check the bitcoin 50-day moving average. Without noticing it, you can lose all of your investment. So, never trade in cryptocurrency without the proper knowledge of its background.
Frequently Asked Questions (FAQs)
What happens when the 50-day moving average crosses the 200-day moving average?
When the 50 Day MA value crosses the 200-day MA value, it is known as the golden cross. We can say it is the right time to switch to bullish.
Where is the 50-day moving average?
If we sum up the last 50 days’ stock data points and then divide the total value by 50, we get a 50 Day MA value.
What is Bitcoin’s 50 days moving average?
Take the sum of the closing value of bitcoin in the last 50 days and then divide the sum by 50. The value you get will be a bitcoin 50 Day MA.
What happens when the 50-day moving average crosses the 100-day moving average?
If the 50-day MA goes above the 100 Day MA, then it is a golden cross. It is the right time to go bullish. If it goes below the 100 Day MA, then it is a death cross. It is a bearish time.
Bottom Line
After reading the whole article, we are sure you know the 50-Day Moving Average. Now, try to practice on a demo app. When you feel you have got enough knowledge, then go for bitcoin trading. Entering the market without knowledge won’t give you good results.